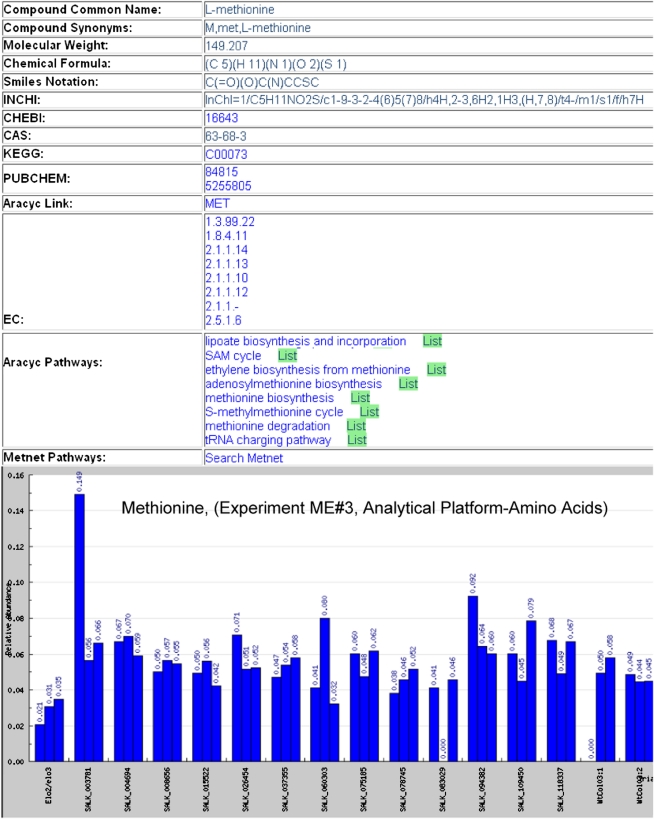
Figure 4.
Metabolite details of Met. An investigator may click on the AraCyc and KEGG links to see metabolite annotations in those databases. The pathway entry shows all the pathways that are impacted by this metabolite and clicking on any pathway name links to AraCyc in the Plant Metabolic Network. Clicking on the List button after a pathway name shows experimental data for all the other metabolites in that pathway. The bar graph shows the abundance of Met in different Arabidopsis mutant lines. All replicates of the same mutant are grouped together for easier outlier detection. Under SALK_003718, the first replicate has unusually high abundance of Met, which signifies that one of the replicates might be an outlier. [See online article for color version of this figure.]

