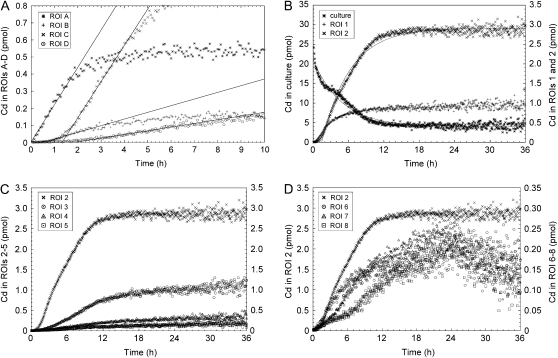
Figure 4.
Time courses of Cd amount in the ROIs shown in Figure 3A. A, Estimation of arrival times at ROIs A, B, C, and D. Fitting lines are indicated. B, Time courses of Cd distribution in the culture solution, roots (ROI 1), and shoot base (ROI 2). Fitting curves for culture and ROI 2 are indicated. C, Time courses of Cd distribution in the shoot base (ROI 2) and leaf sheath (ROIs 3–5). D, Time courses of Cd distribution in the shoot base (ROI 2) and crown root (ROIs 6–8).

