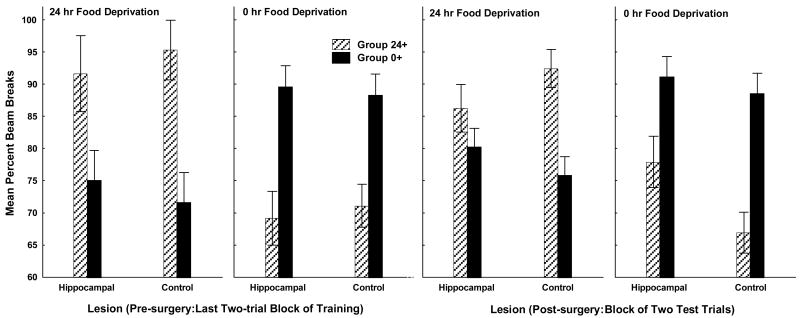
Figure 3. Deprivation intensity discrimination testing.
Leftmost two panels show mean photobeam interruption over the last two-trial block of training (pre-surgery) under 24-h and 0-h food deprivation for rats that were to subsequently receive lesions of the complete hippocampus (Hippocampal) and the combined operated and unoperated controls (Control). The two rightmost panels of show data collected for the Hippocampal and Control rats after surgery. Error bars represent S.E.M.

