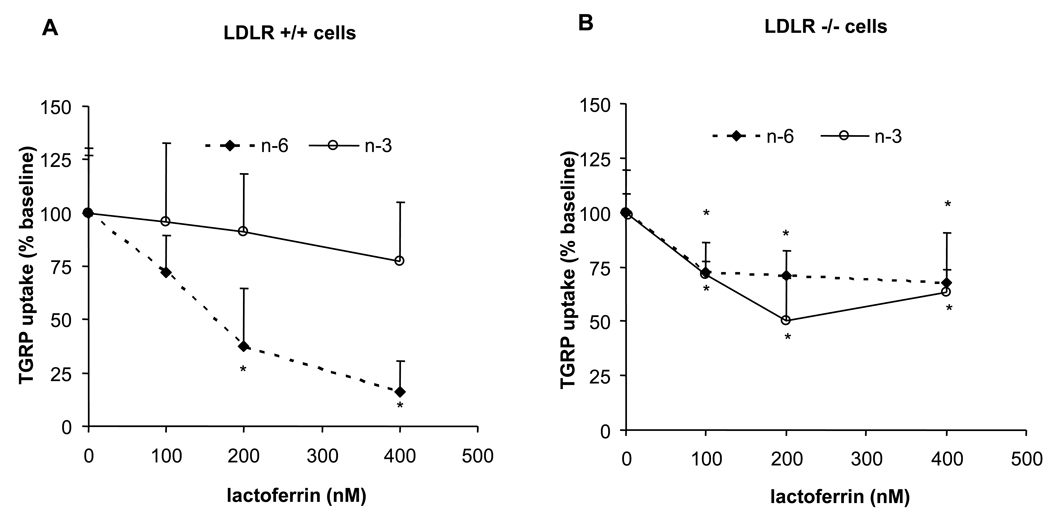
Figure 2. Effects of lactoferrin on the uptake of n-6 and n-3 TGRPs.
Concentration-dependent effect of lactoferrin on TGRP uptake in LDLR+/+ (A) and (B) LDLR−/− fibroblasts. Cells were incubated in the presence of 1% BSA, [3H]CEt-TGRP (200 µg/ml), and in the presence of apoE (5%w/w) and lactoferrin (0–400 nM), at 37 °C for 4 h to measure apoE-mediated pathways. Results are the mean ± SD of triplicate determinations expressed percentage (%). Baseline value of no lactoferrin treatment was set at 100%. * p < 0.05, significant decrease from baseline.

