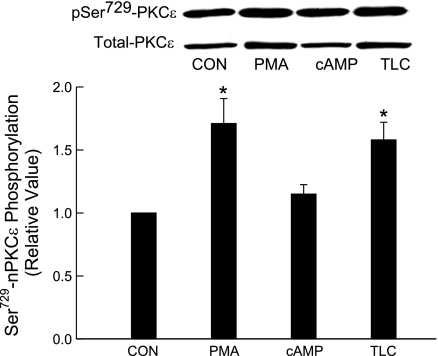
Fig. 9.
Effects of TLC, PMA, and cAMP on nPKCε-Ser729 phosphorylation. HuH-NTCP cells were treated with 1 μM PMA, 100 μM CPT-CAMP, or 10 μM TLC for 15 min followed by determination of phospho PKCε and total PKCε. Top: typical immunoblot analysis of phospho (pSer729-PKCε) and total PKCε (loading control). Bottom: result of densitometric analysis (means ± SE; n = 4). *Significantly different from control values (P < 0.05).

