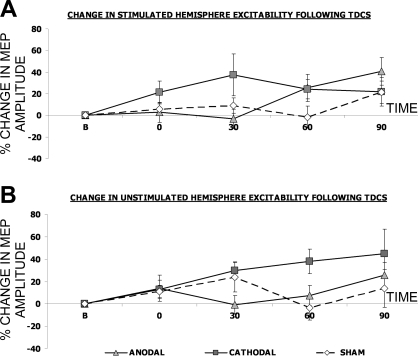
Fig. 2.
Percentage change (means ± SE) in pharyngeal motor evoked potential (MEP) amplitudes in response to single-pulse transcranial magnetic stimulation (TMS) over the stimulated hemisphere (A) and the unstimulated hemisphere (B), following either anodal (triangles), cathodal (squares), or sham (diamonds) tDCS given for 10 min at 1 mA tDCS. There were no significant changes from baseline.

