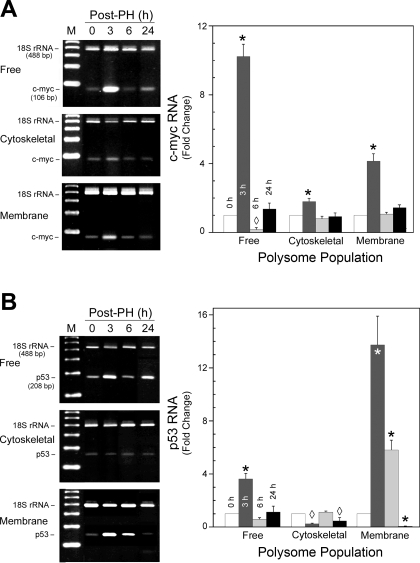
Fig. 3.
Flux of c-myc and p53 mRNAs through the 3 different polysome populations during rat liver regeneration. Representative agarose gels and densitometric analyses of the PCR products obtained with Competimer PCR for c-myc (A) and p53 (B) visualized by ethidium bromide staining and ultraviolet light are shown. Predicted size and identity of the 18S rRNA and transcript-specific amplicon are shown at left, with the specific polysome population. Fold change normalized to the 18S rRNA signal relative to 0 time is shown in the graphs and represents means ± SD from ≥3 animals. *P < 0.001, ◊P < 0.05 compared with time 0.

