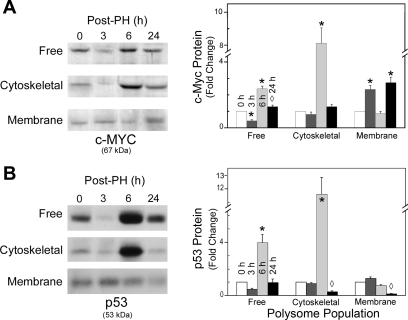
Fig. 4.
Levels of c-myc and p53 nascent proteins detected in the different polysome populations. Representative Western blots of c-myc (A) and p53 (B) detected with anti-c-myc or p53 primary antibodies and horseradish peroxidase-conjugated secondary antibodies by enhanced chemiluminescence as described in materials and methods are shown. Protein and predicted size are indicated at bottom; polysome population and time after PH are shown at left and above the Western blots, respectively. Densitometric analyses of the c-myc (A) and p53 (B) protein levels are shown at right of their respective Western blots. Fold change relative to time 0 in the graphs represents the mean ± SD from ≥3 animals. *P < 0.001, ◊P < 0.05 compared with time 0.

