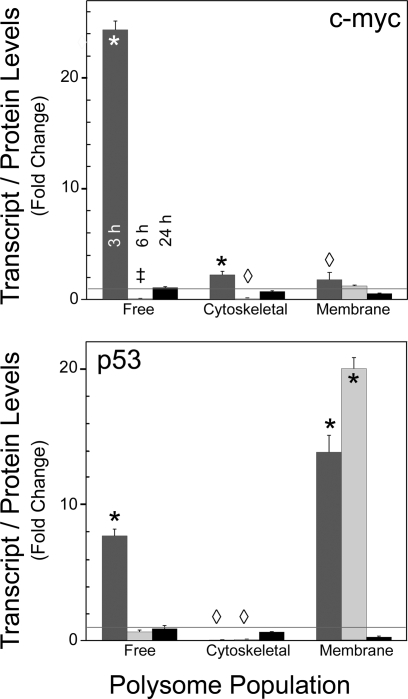
Fig. 6.
Modulation of transcript-to-protein ratios in the different populations. Changes in the ratios observed in the different polysome populations for c-myc and p53 are shown at top and bottom, respectively; time 0 ratios between transcript and nascent protein levels in arbitrary densitometric units are set to 1. A significant deviation from unity (horizontal line) indicates that the ratio between steady-state levels of transcripts and protein changed in the polysome population relative to quiescent liver. *P < 0.001, ‡P < 0.01, ◊P < 0.05 compared with time 0.

