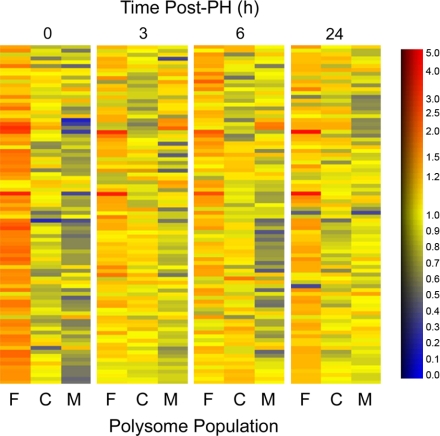
Fig. 7.
Distribution of 85 distinct mammalian microRNAs (miRNAs) in regenerating liver. miRNA probes that gave the strongest hybridization signals in all 3 polysome populations at 0, 3, 6, and 24 h after PH are shown. At time 0, the free (F) polysome population contained the strongest normalized hybridization signals for practically all the miRNA probes. Relative abundance of individual miRNAs in different polysome populations is presented as heat maps. At 0 h, the free polysome population (far left) is dominated by orange to red colors, which signify high relative abundance, while the cytoskeletal (C) and membrane-bound (M) populations are colored mostly by blue and yellow, indicating lower expression levels. The scale is shown at right, with the relative abundance in arbitrary units.

