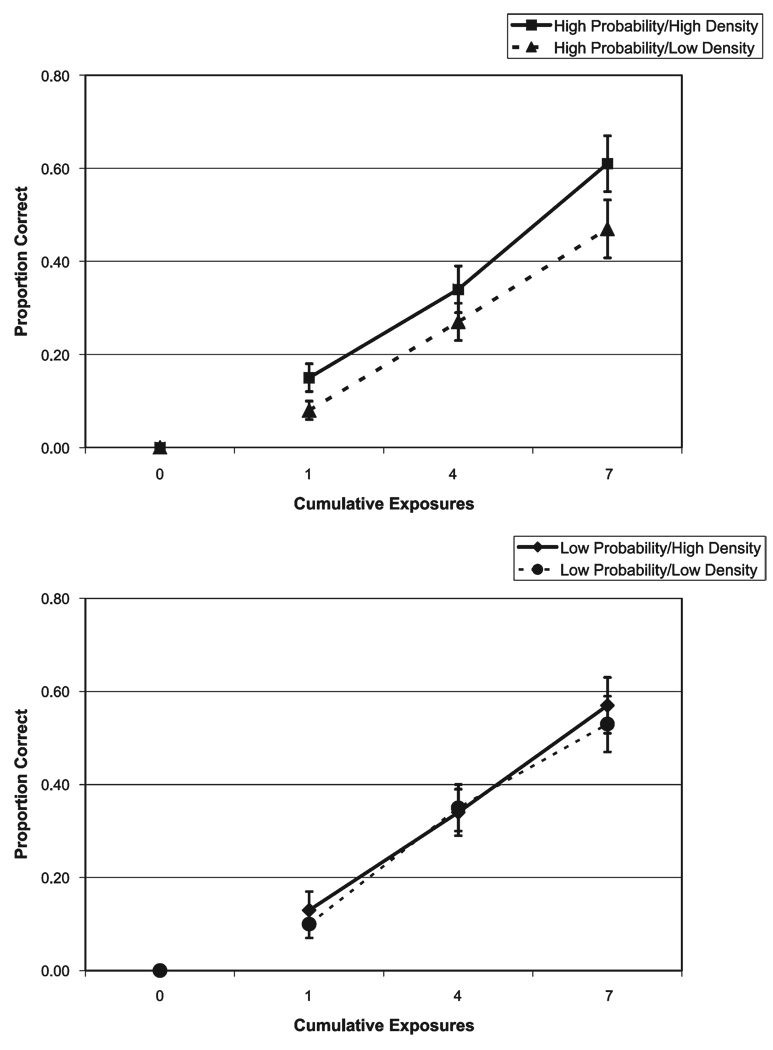
Figure 6.
Proportion of completely correct responses (i.e., three of three phonemes correct) by cumulative exposure for high density (diamonds, squares) versus low density (circles, triangles) for high-probability (top panel) and low-probability nonwords (bottom panel). Note that these are the same data as in Figure 5 but rearranged to afford easier comparison of high versus low density.

