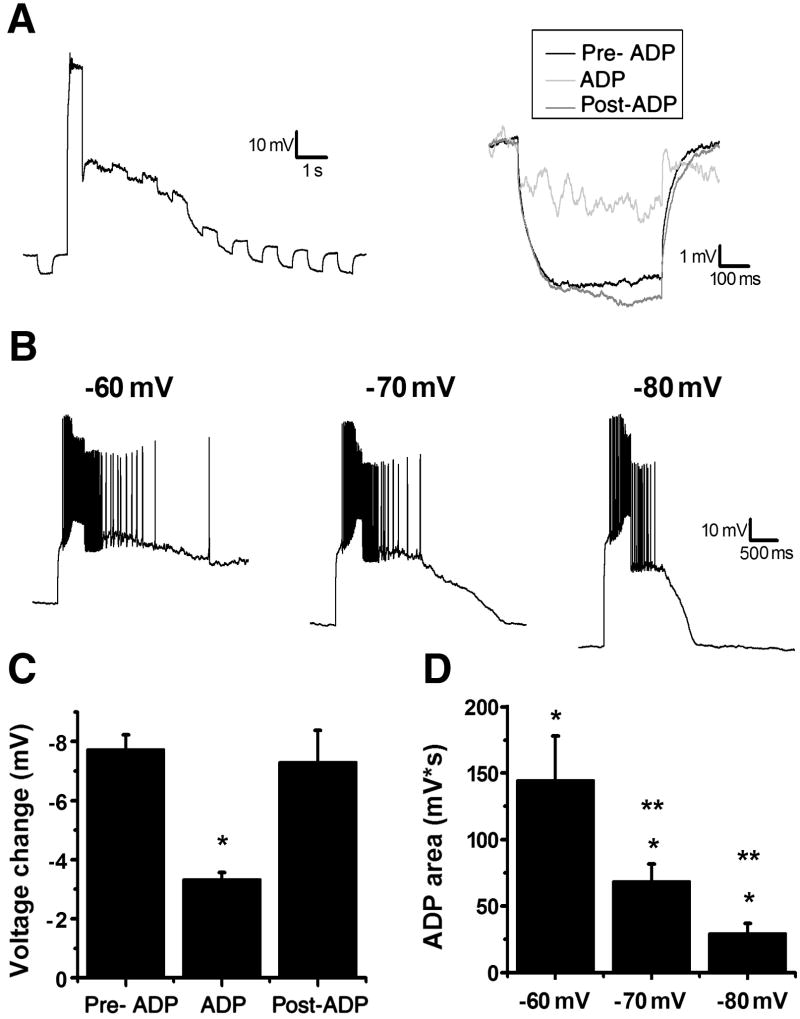
Figure 2. ADP depends on opening a voltage dependent channel.
A, left: A 500 ms, −40 pA hyperpolarizing pulse was applied before and after the depolarization in the presence of 1 μM TTX to investigate changes in input resistance. Right: An inset of three hyperpolarizing pulses from the representative cell to the left: black represents the pulse before the depolarization, light gray is the first pulse after depolarization, and dark gray is a pulse after the membrane potential returned to −60 mV. B: A single cell representation of the effect of voltage on the ADP. The ADP is smaller at more hyperpolarized potentials (middle, −70 mV and right, −80 mV) compared to control (left, −60 mV). C: Summary plot of the Δvoltage to a hyperpolarizing pulse before, during, and after an ADP. *p<0.05 compared to pre-ADP. D: Summary plot of the area of the ADP at different membrane potentials. *p<0.05 compared to control (before muscarine). **p<0.05 compared to muscarine at −60 mV.

