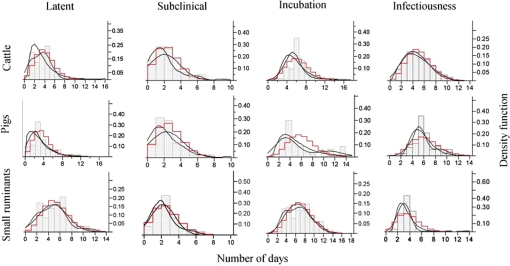
Figure 2.
Frequency distributions and probability density functions fit to continuous (grey boxes) and discrete (red) data for experimental animals and FMD stage. Non-parametric density estimation using the kernel standard deviation (dashed line) was estimated for smoothing the distribution. (A color version of this figure is available at www.vetres.org.)

