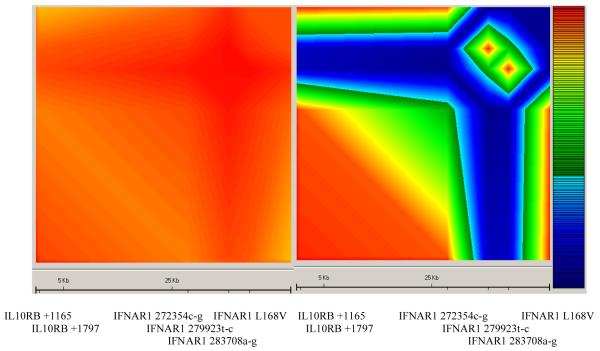
Figure 3.
Comparative linkage disequilibrium maps comparing the extent of LD between the Gambian (left) and Vietnamese (right) studies constructed using the six polymorphisms found to be highly significant in the Gambian malaria study. The key to the right shows the colour scale representing increasing LD from dark blue (D′<0.1) through to red (D′>0.9).

