
Fig. 6.
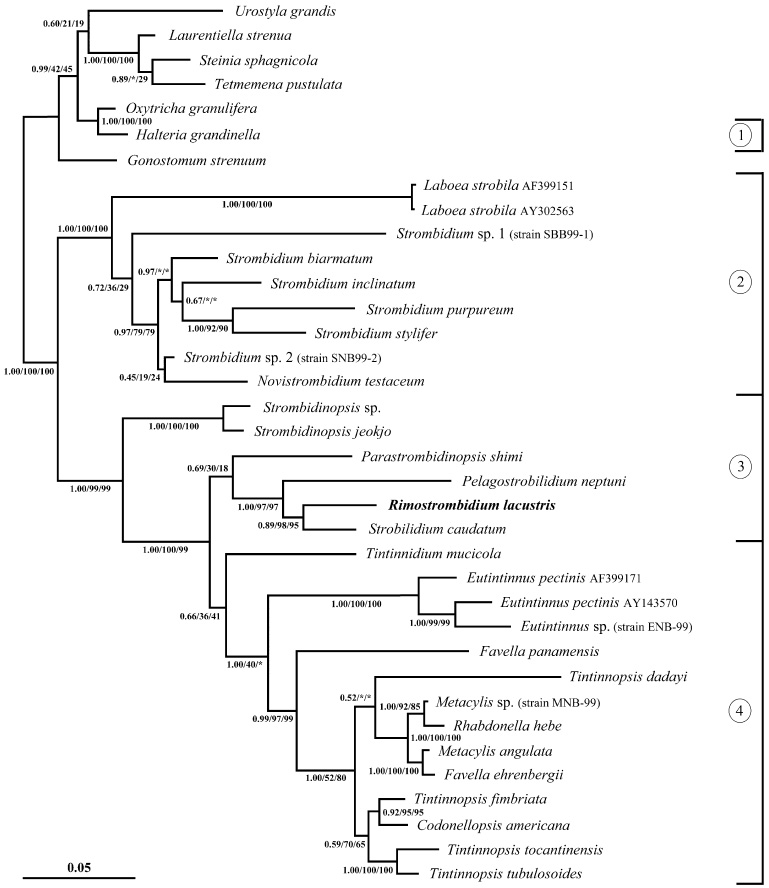
Maximum likelihood tree of SSrRNA gene sequences computed with MrBayes ver. 3.1.1 (Ronquist and Huelsenbeck 2003), based on the GTR model with gamma-distribution plus invariable sites, determined by MrModeltest (Nylander 2004). The first numbers at the nodes are the posterior probability values out of 1,000,000 trees from a maximum likelihood analysis, employing the Bayesian Inference; the second and third numbers are the bootstrap values (percent out of 1000 replicates) for the maximum parsimony (Swofford 2002) and neighbour-joining analysis (Saitou and Nei 1987), respectively. An asterisk indicates bootstrap values of <10%. The scale bar represents five expected changes per 100 positions. The new sequence appears in bold face: 1, order Halteriida (class Oligotrichea, subclass Halteriia); 2, order Oligotrichida (class Oligotrichea, subclass Oligotrichia); 3, suborder Strobilidiina (class Oligotrichea, subclass Oligotrichia, order Choreotrichida); and 4, suborder Tintinnina (class Oligotrichea, subclass Oligotrichia, order Choreotrichida).