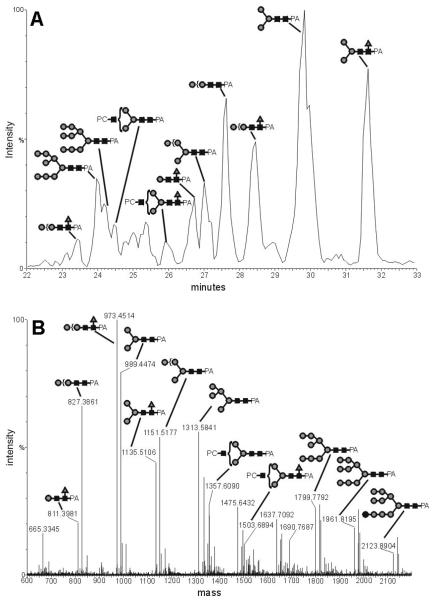
Figure 3. LC-ESI-MS of 2-aminopyridine-derivatised N-glycans from Ascaris suum.
N-glycans were analysed by ESI-MS following graphitised carbon chromatography: A) the chromatogram in terms of ion intensity; B) the accumulated MS spectra from 23 to 32 minutes. The [M+H]+ Ions have been calculated by use of the Masslynx-MaxEnt3 software from the raw multiply-charged ion data. Selected peaks are annotated with black squares indicating GlcNAc, grey circles mannose and grey triangles fucose.

