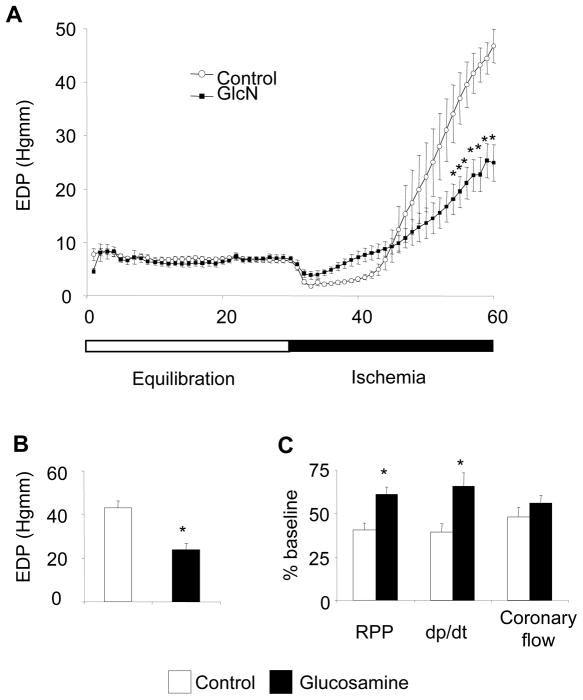
Figure 1.
A: Trace of end diastolic pressure (n=11 in each group), *: p<0.05 vs. control (Two-Way ANOVA with Bonferroni posthoc test); B: End diastolic pressure at the end of 30 minutes ischemia (n=11 in each group), *: p<0.05 vs. control (Student’s t-test) C: Percentage of recovery of function compared to baseline values (n=5 in each group), * p<0.05 vs. control (Student’s t-test). (RPP: rate pressure product (heart rate x left ventricular developed pressure; dp/dt: maximal change in left ventricular pressure over time)

