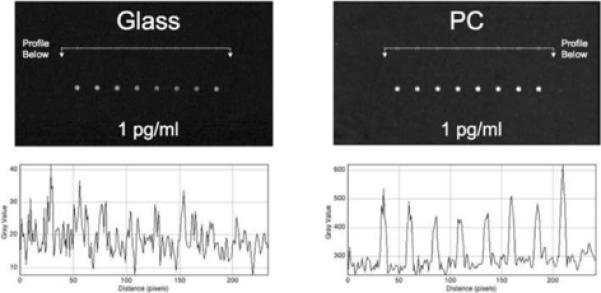
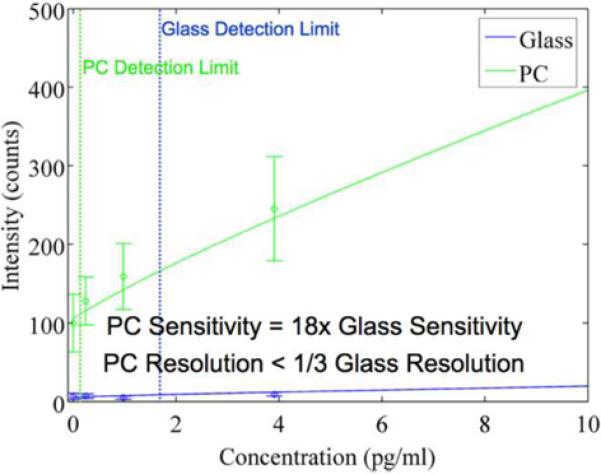
Figure 4.


a). Fluorescent intensity images gathered with a confocal laser scanner for ~100 μm diameter spots of anti-TNFa capture probe after exposure to a 1 pg/ml solution of TNFα and subsequent labeling with Cy5-labeled secondary antibody. At this concentration, detection is near the detection limit when the assay is performed on a glass surface, but the PC surface shows robust signal-to-noise ratio. b). Dose-response characteristic for the TNFα assay, showing enhanced signal using the PC surface. Full assay details are provided inAnal. Chem. Vol. 80, No. 23, p. 9013, 2008.
