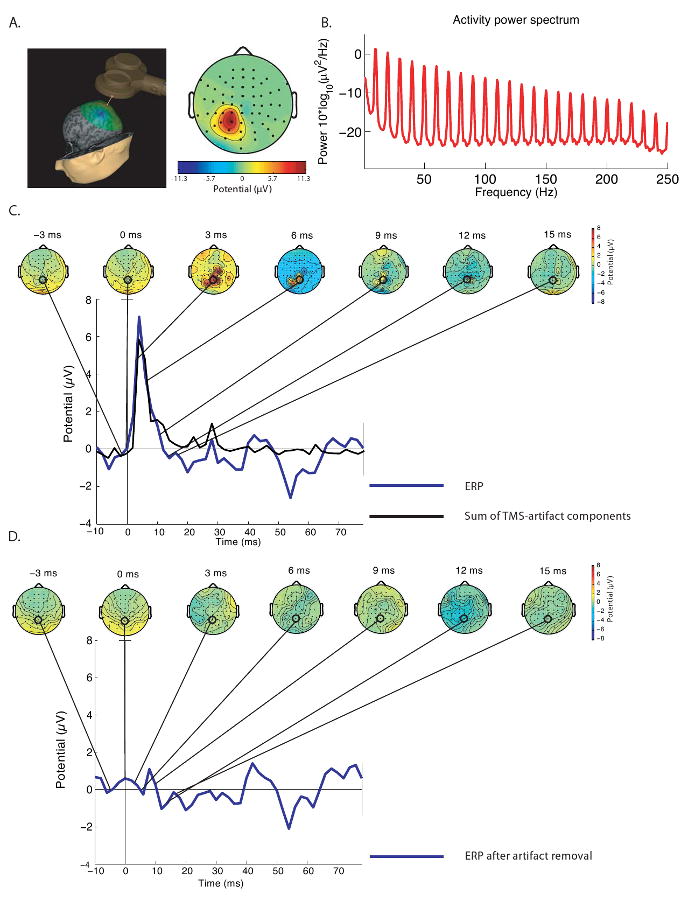
Figure 1.

Representative TMS-artifact component identified by ICA. A) This panel illustrates that a typical artifact was limited to the electrodes immediately below or next to the location of stimulation. In this example, the SPL was targeted (near electrode P1). B) Power spectrum of the artifact reveals a strong, sharp peak at 10 Hz and corresponding harmonics. C and D illustrate the effectiveness of ICA in removing TMS-related EEG artifacts for a representative subject. Shown are scalp topographies time-locked to the onset of the TMS pulse before (C) and after (D) removal of 7 ICA components representing the TMS-related artifact. Also shown is the summed time course of activity of these 7 artifact components (black line, C), as well as the TMS-induced evoked responses after artifact removal (blue line, D). As can be seen in this figure, the artifact was most prominent in the first 10 ms after the TMS pulse.
