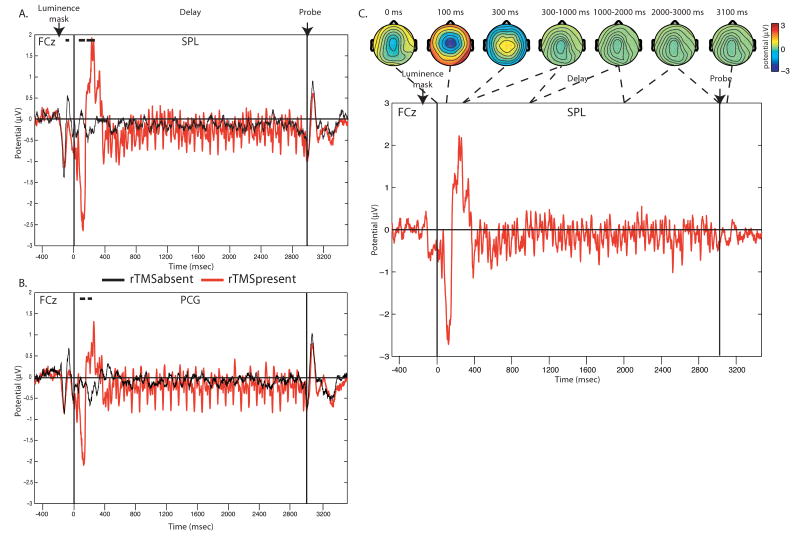
Figure 2.
Delay-period neuronal activity, averaged across all subjects, at electrode FCz in the absence (black line) and presence (red line) of 10 Hz rTMS, shown separately for SPL (A) and PCG (B) stimulation. As can be seen, the onset of the rTMS train was associated with a strong negativity around 100 ms, followed by a positivity between 200 and 400 ms. Lines above the graph indicate time period for which the rTMSpresent – rTMSabsent contrast revealed a significant difference in neuronal activity (paired t-test, p<0.05) for at least 20 consecutive samples (40 ms). (C) The difference in delay-period activity in rTMSpresent vs. rTMSabsent trials with scalp topographies (shown for SPL rTMS).

