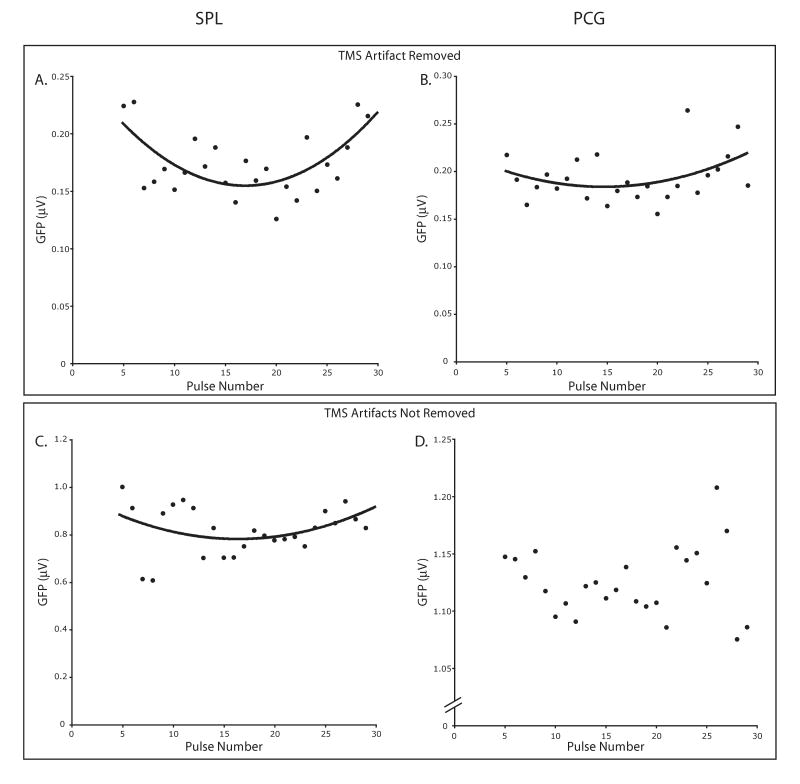
Figure 3.
Mean changes in the amplitude of TMS pulse-evoked brain responses across the rTMS train with and without removal of ICA components. Shown are GFPmean values averaged across the 100-ms time window after each pulse for pulses 5-29. A and B show GFPmean values after removal of ICA components representing TMS-related artifacts for SPL and PCG rTMS, respectively. C and D represent the same data without the removal of these components. Significant quadratic relationships between pulse number and GFPmean amplitude are displayed.

