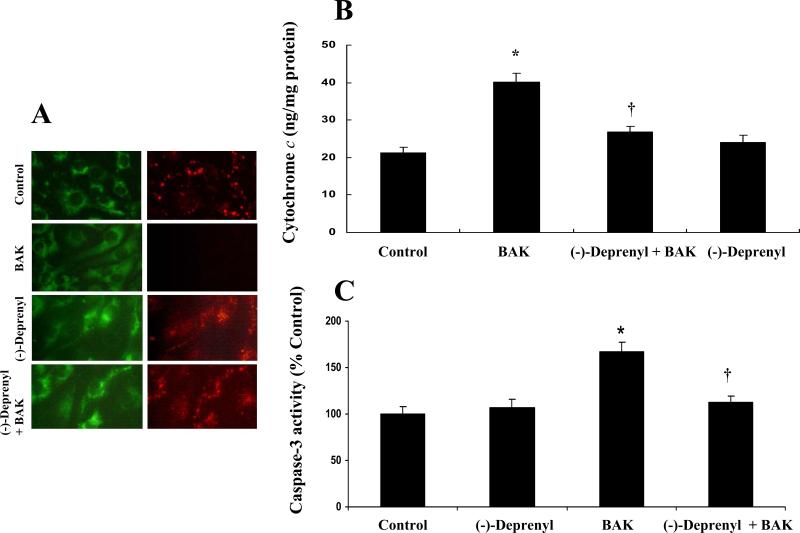
Figure 6.
A. Effect of (-)-deprenyl on BAK (BH3)-induced collapse of mitochondrial transmembrane potential. In untreated (control) cells and (-)-deprenyl (10 μM) treated cells, JC-1 fluoresce red representing intact mitochondria. Following BAK (BH3) transfection, there is a decrease in red (mitochondrial) fluorescence indicating the loss of mitochondrial transmembrane potential. BAK (BH3) transfected cells pre-treated with (-)-deprenyl shows red fluorescence indicating the recovery of mitochondrial membrane potential. B. Effect of (-)-Deprenyl on BAK (BH3)-induced cytochrome c release. In BAK (BH3) transfected cells, cytosolic levels of cytochrome c is significantly higher in comparison to the control cells. *(p < 0.05; n = 5). The cytochrome c levels show a significant decrease in BAK (BH3)-transfected cells pre-treated with (-)-deprenyl (10 μM) in comparison to BAK (BH3)-transfected cells without (-)-deprenyl pre-treatment. †(p < 0.05; n = 5). C. Effect of (-)-Deprenyl on BAK (BH3)-induced caspase-3 activity. In BAK (BH3) transfected cells, caspase-3 activity is significantly higher in comparison to the control group *(p < 0.05; n = 5). The caspase-3 activity shows a significant decrease in BAK (BH3)-transfected cells pre-treated with (-)-deprenyl (10 μM) in comparison to BAK (BH3)-transfected cells without (-)-deprenyl pre-treatment. †(p < 0.05; n = 5).

