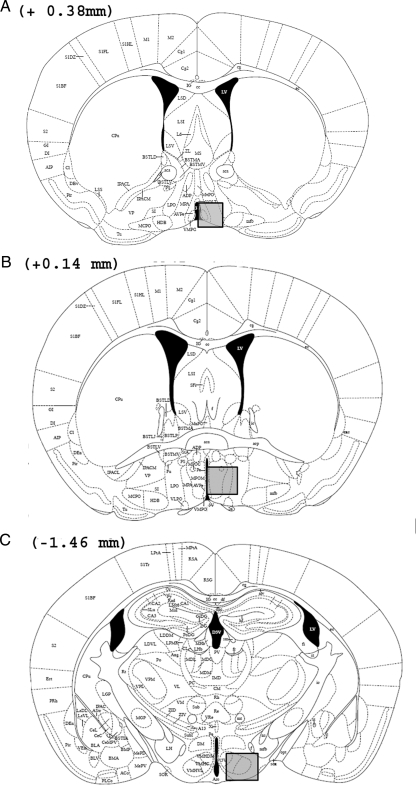
Figure 1.
Drawings taken from the mouse brain atlas of Paxinos and Franklin (24) showing the location of forebrain regions in which PR-ir cells were quantified (shaded areas in each panel) in the AVPv (A), MPOA (B). and VMH-L (C). The distance of each coronal brain slice in front of (+) or behind (−) bregma is given for each panel.

