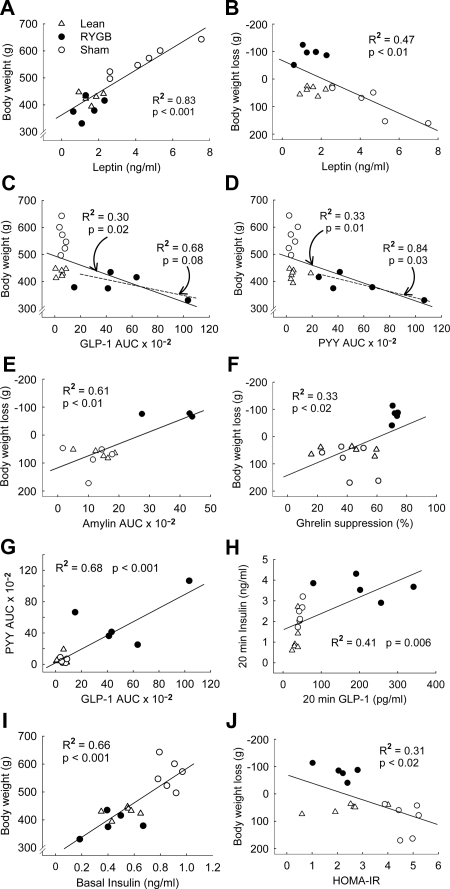
Figure 7.
Linear regression analysis of relationships between body weight or weight loss with various circulating hormones or postprandial hormone responses. Correlations included either all treatment groups (lean controls, open triangles; sham-operated obese, open circles; RYGB, filled circles; full regression lines) or only RYGB rats (dotted regression lines), and only significant correlations are shown. A and B, Leptin levels are positively correlated to body weight and negatively to body weight loss using all treatment groups. C and D, Areas under the curve (AUC) for GLP-1 and PYY are negatively correlated to body weight across all treatment groups and for RYGB rats only. E and F, AUC for amylin and percent suppression of acylated ghrelin are positively correlated with body weight loss. G, GLP-1 and PYY AUCs are positively correlated. H, Twenty-minute peaks of GLP-1 and insulin are positively correlated. I, Basal insulin is positively correlated with body weight. J, HOMA-IR is negatively correlated with body weight loss.

