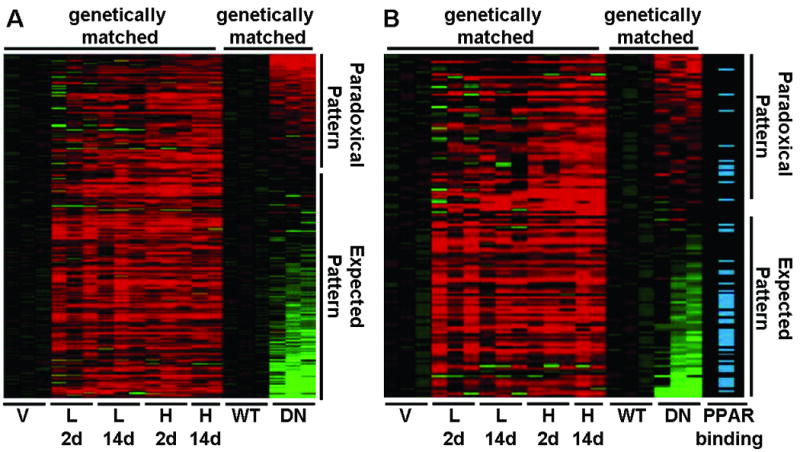
Figure 3. Expression Clustering and Functionally Validated PPRE.

A. Expression clustering of genes up-regulated in at least one RZ-treatment group. All gene expression values have been log2 transformed and normalized to the appropriate control. Mice received rosiglitazone at either a low (3 mg/kg/day, L) or high (10 mg/kg/day, H) dose for either 2 (2d) or 14 (14d) days. Each column represents a sample, and each row a gene. Increasing intensity of red or green color indicates greater up- or down-regulation, respectively. Black indicates no change in expression. B. Association of PPARγ binding sites identified by Chip-ChIP in 3T3-L1 differentiated adipocytes with genes up-regulated in aorta in at least one RZ-treatment group. Only those genes expressed both in 3T3-L1 cells and aorta were included.
