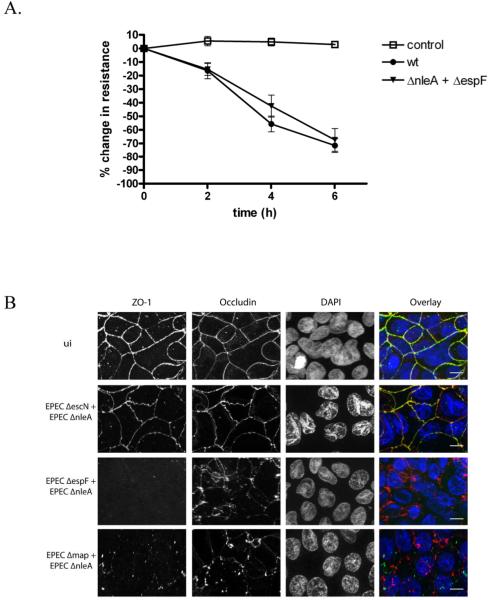
Figure 6. The inability of a NleA mutant to disrupt tight junctions can be complemented in trans.
A. T84 cells were polarized on semi-permeable filter inserts and then infected with the wildtype EPEC or a 1:1 mixture of EPECΔnleA and EPECΔespF. Transepithelial resistance was measured before infection and at 2, 4 and 6 hours post infection. Data is expressed and the % change in resistance compared with resistance at time 0. Each point represents the mean +/− the standard error of the mean from 9 biological replicates from 3 separate experiments. Control = uninfected cells processed in parallel. B. Caco2 cells were polarized on semi-permeable filter inserts and then infected with 1:1 mixtures of the EPEC strains indicated for 6 hours. Uninfected cells were processed in parallel (ui). Samples were fixed and immunostained for ZO-1 (left panel, green in the overlay), occludin (2nd panel from left, red in the overlay) and nuclei were stained with DAPI (3rd panel from left, blue in the overlay). An overlay is shown in the right panel. Scale bar = 20 micrometers.

