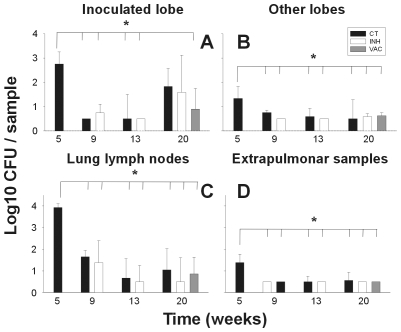
Figure 1. CFU values in the lungs.
Data (mean and standard deviation) are presented by comparing an inoculated lobe with others (pictures A and B), lung lymph nodes (C), and extrapulmonary samples (D). Every sample collected weighted 2 g. approximately. * signifies a statistically significant difference in the one-way ANOVA test (p<0.005). CT = control group; INH = chemotherapy with isoniazid; VAC = group treated with vaccine therapy.

