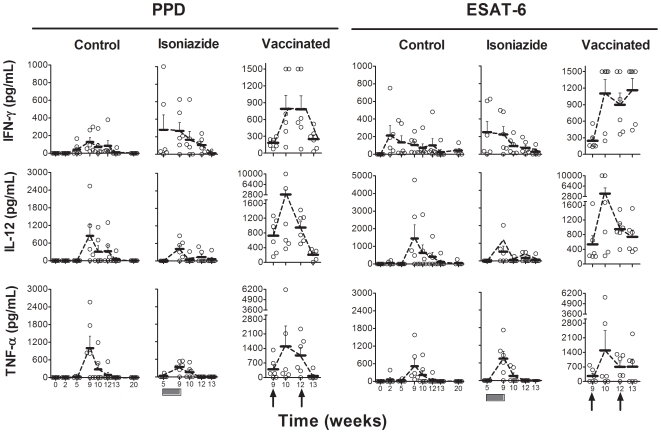
Figure 2. Evaluation of the cellular immune response by ELISA assay.
ESAT-6 and PPD-specific IFN-γ, IL-12 and TNF-α production after stimulation of PBMCs, as determined by ELISA assay. Means and standard error of the means (SEM) are drawn in gray and connected by dotted lines. The black boxes show the period of INH treatment and the black arrows the time of therapeutic vaccination.

