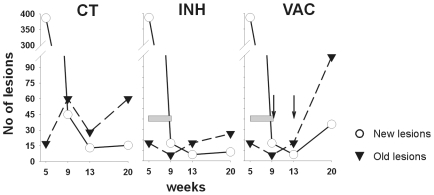
Figure 10. Evolution of recent and old lesions.
The results show the median of the values represented in Table 2. The gray bar shows the INH treatment period and vaccine inoculation is represented by the black arrows. CT = control group; INH = chemotherapy with isoniazid; VAC = group treated with vaccine therapy.

