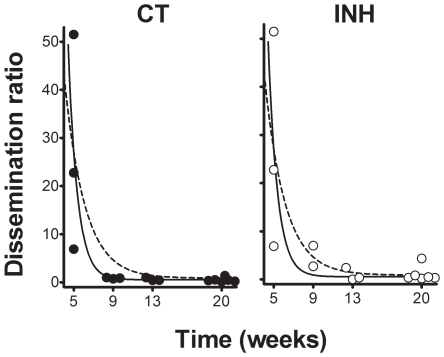
Figure 11. Evolution of the dissemination rate (DR).
Individual data points are represented by full or open circles in control (CT) and isoniazid-treated (INH) groups respectively, and are adjusted to an exponential regression. The continuous and dotted lines represents the adjustment for the CT (y = 5620.45−1.071·x + 0.5460) and INH (y = 295.62−0.4848·x +0.8793) groups. Both adjustments were statistically significant (p<0.0001)

