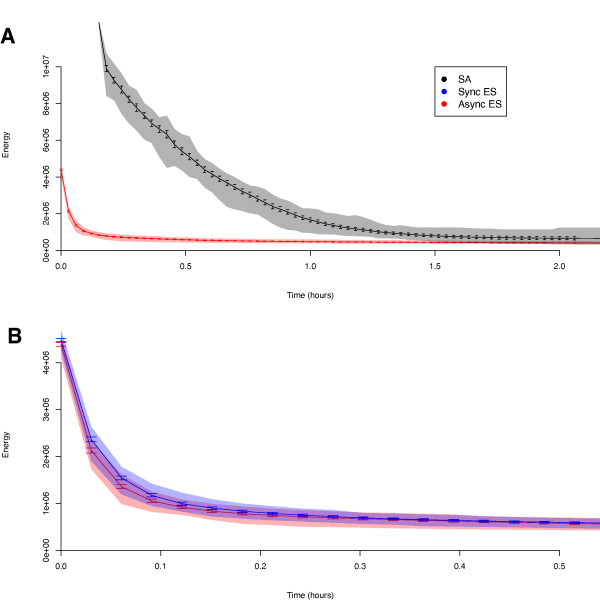
Figure 3.
Descent Curves for piES and pLSA Algorithms. (A) Mean descent curves for the asynchronous piES and pLSA. (B) Mean descent curves for the asynchronous and synchronous piES. Error bars show 95% confidence intervals on the mean. Coloured regions show the area in which 95% of runs fall. All curves are for 10-node runs. Results for 20- and 50-node runs were similar (data not shown).

