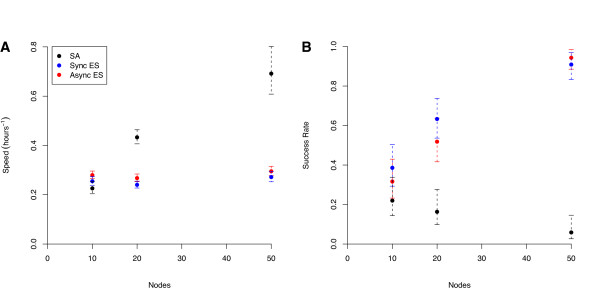
Figure 5.
Comparison of Algorithms for 'Good' Solutions. A comparison of (A) the speed and (B) the robustness or reliability of the three algorithms (asynchronous and synchronous piES, and pLSA) for achieving a 'good' solution (an objective function value of 350000 or less). Axes and error bars as in Figure 4.

