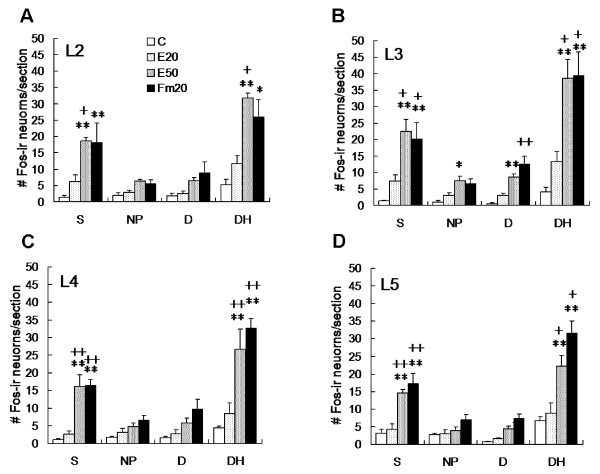
Figure 3.
Numerical analysis of Fos-ir neurons at the side ipsilateral to the conditioning stimulus. Fos-labeled neurons were significantly higher in the Fm20 and E50 groups than in the control and E20 groups regardless of the spinal segment. No significant difference was found between the C and E20 groups, or between the Fm20 and E50 groups for all segments and laminae. Topographically, E50-induced Fos expression was higher in the higher segments (L2 and L3) than in the lower lumbar segments (L4 and L5). S, superficial laminae I/II; NP, nucleus proprius, laminae III/IV; D, deep laminae V; DH, dorsal horn. Rat numbers: C = 6, E20 = 6, E50 = 5, Fm20 = 6. * p < 0.05, ** p < 0.01 vs. C; + p < 0.05, ++ p < 0.01 vs. E20; one-way ANOVA with Bonferroni's post hoc test.

