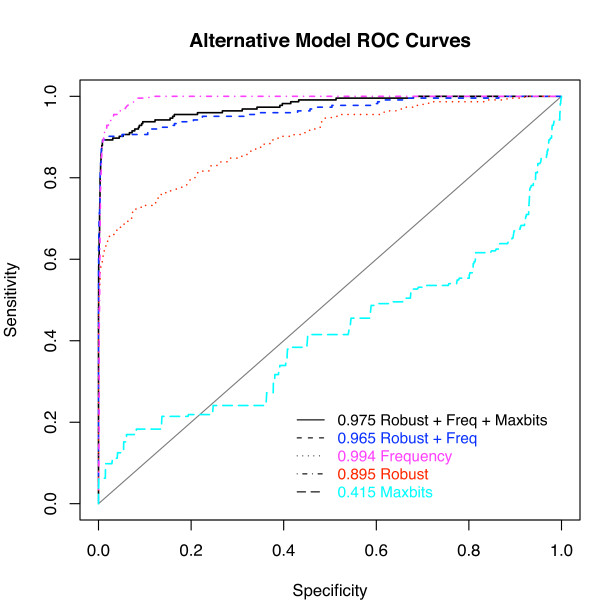
Figure 5.
Comparison of various logistic regression models in identifying structurally accurate alignment edges using the Receiver Operator Characteristic (ROC). The test set of 5000 edges (see Methods) from the 75% of optimal neighborhood was ranked by the log-odds score produced by the full logistic regression model, by a model using just frequency and robustness, and by models using the three variables independently. If a particular edge was found in 2 out of the 4 structural alignments, it was considered a true positive. (Using different thresholds for true positives did not substantially affect the performance.) The x-axis plots the probability of a false positive, while the y-axis plots the probability of a true positive. Curves higher and further to the left do a better job predicting whether an edge will be found in a structural alignment. The area under the curve (AUC) is reported for each of the models used.

