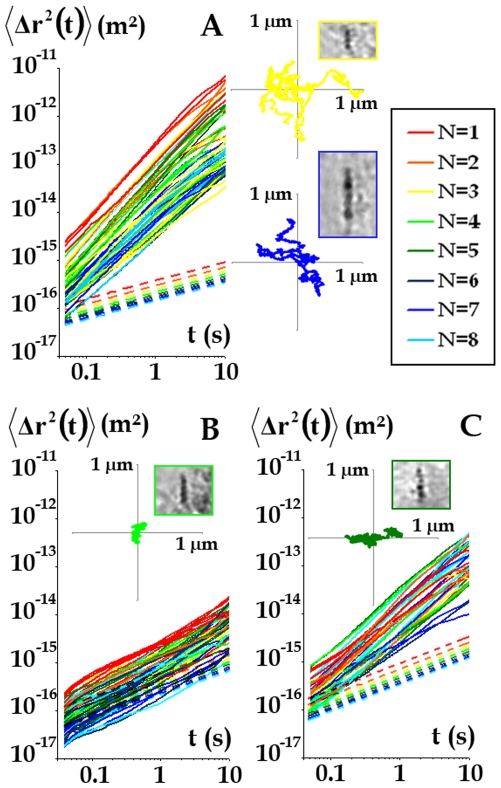
Figure 3. Probes fluctuations.
The mean square displacement  is colour-coded according to the number of endosomes, N, in the chain, and plotted against time (solid lines), in cells with an intact cytoskeleton (A) and in cells with actin filaments only (B) or microtubules only (C). The dotted lines correspond to the mean square displacement
  calculated using the FDT, as if the system was at equilibrium. Typical trajectories are presented in the insets, together with a view of the corresponding chain.

