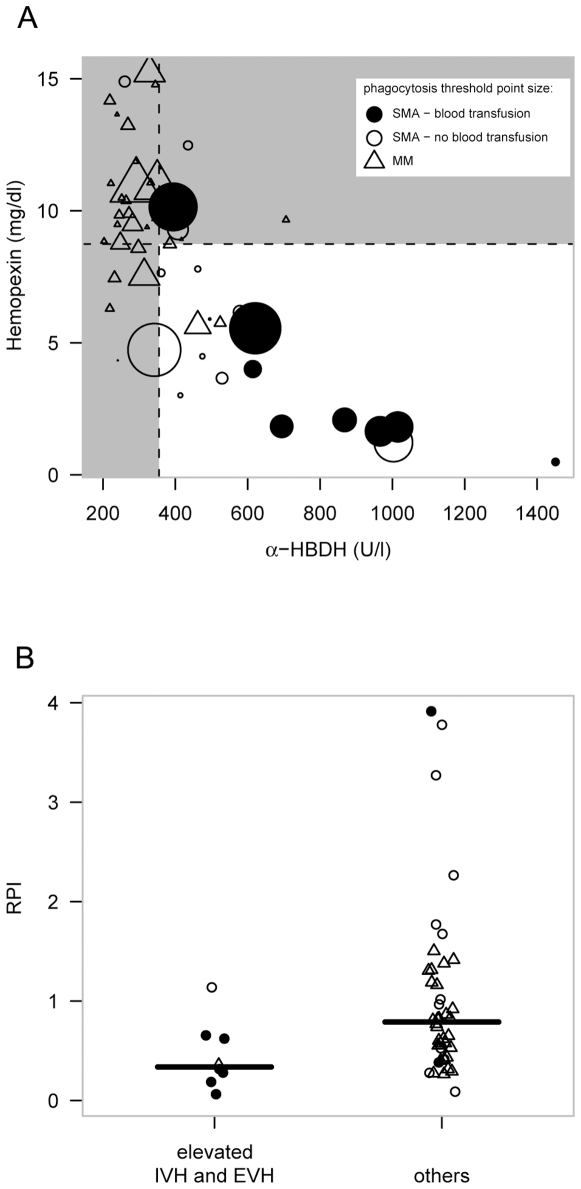
Figure 3. Distribution of enhanced intravascular and extravascular hemolysis across the patient groups and its correlation with reduced RPI: In figure A), a dot plot of α-HBDH vs. hemopexin concentration, both makers for IVH, at presentation is shown on the x and y axis, respectively.
The size of the data symbols represents erythrophagocytosis activity, a direct marker of EVH (the bigger the symbol, the higher the autologous erythrophagocytosis). Classification criteria for “elevated IVH and EVH” match for those symbols bigger than the borderline levels shown in the plot and laying in the white region. Figure B: The Group having both “elevated EVH and IVH” had significantly lower reticulocyte productions indices than the other patients (p<0.05). Δ MM; ○ SMA - non transfused; • SMA - blood transfused.

