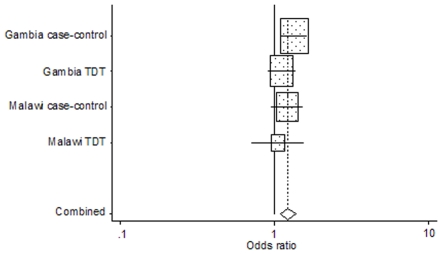
Figure 1. Forest plot of the odds ratios of severe malaria allelic associations at the rs9624472 locus.
Odds ratios of severe malaria associations with the rs9624472 G allele are represented for each study as a grey box with a horizontal line. The mid-point of the line represents the odds ratio and the extreme points of the line represent the 95% CI. The contribution of each study to the meta-analysis is represented by the area of the grey box. The solid vertical line presents an odds-ratio of 1 (no association). The diamond at the bottom presents the overall odds ratio and CI: OR = 1.22 (95% CI: 1.09–1.37), P = 0.001. Cochran's Q-test for heterogeneity on 4 degrees of freedom: P = 0.501.

