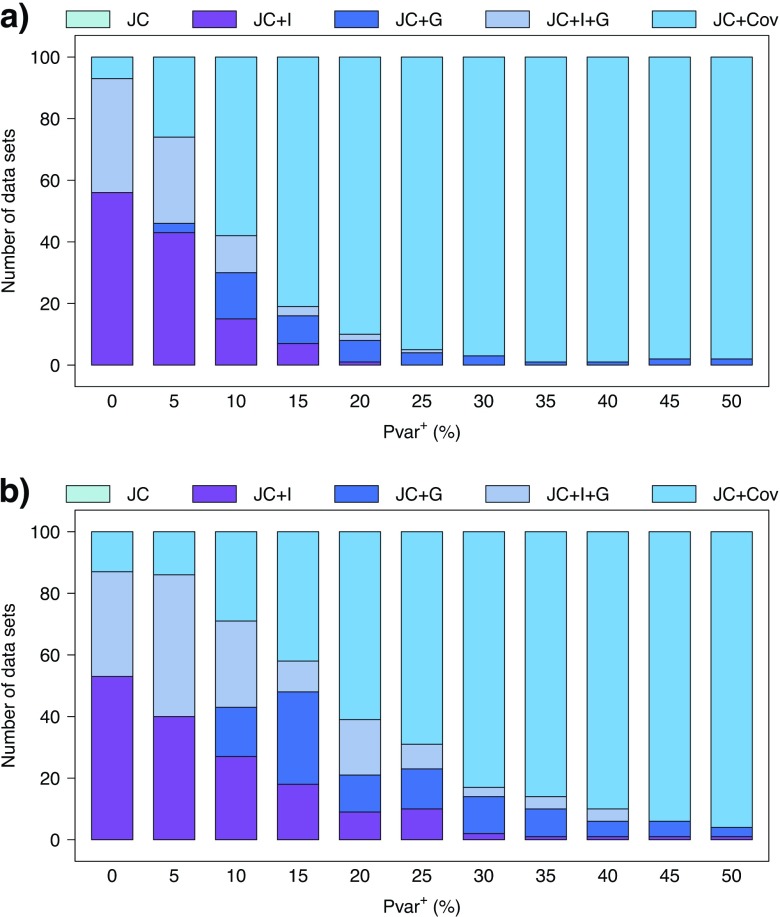
FIGURE 5.
Best-fit model for the 4-taxon simulations a) without and b) with the covarion model. Comparison of the number of times each of the 5 models (JC, JC + I, JC + G, JC + I + G, and JC + Cov) was found to be the best-fit model using the a direct comparison of the harmonic means of the estimated marginal likelihoods.

