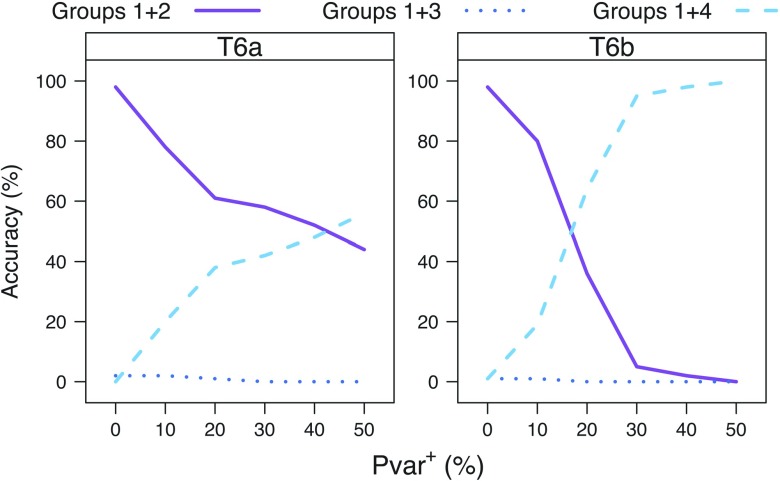
FIGURE 8.
Comparison of reconstruction accuracy of the main split of the tree T (Groups 1 + 2 vs. Groups 3 + 4) for general increased taxon sampling versus increased taxon sampling under the 2 events. The tree reconstruction accuracy for the data simulated under (A,(E,H)),((I,L),P)) and ((A,D),H),(I,(M,P))) using the JC + Cov model is shown for an increasing Pvar+=(0, 10, 20, 30, 40, 50).

