
Figure 2.
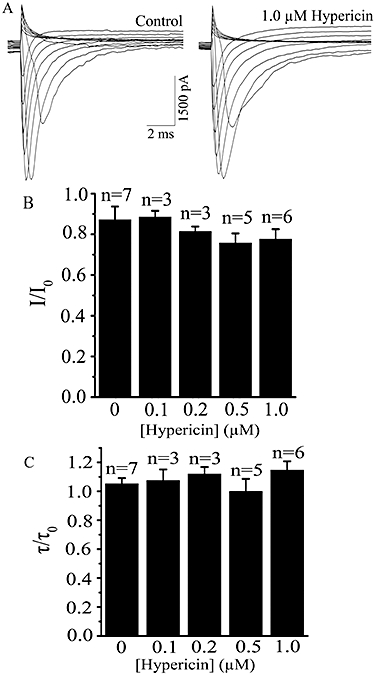
Effects of hypericin on the whole-cell peak Na+ currents. (A) Current traces showing effect of extracellularly applied 1.0 µM hypericin on whole-cell Na+ currents (representative of seven cells). The currents was evoked by voltage steps from −100 mV to +20 mV in 10 mV increments for 12 ms. (B) Summary data of the ratio (I/I0) of the whole-cell Na+ peak currents before (I0) and after (I) application of different concentrations of hypericin. (C) Summary data of the ratio (τ/τo) of the decay time constant of Na+ current evoked at −30 mV before (τ0) and after (τ) application of different concentrations of hypericin. The decay time constant of Na+ current was derived by fitting a single exponential. There are no significant differences between control and different hypericin concentration groups in both (B) and (C) (P > 0.05, one-way anova).