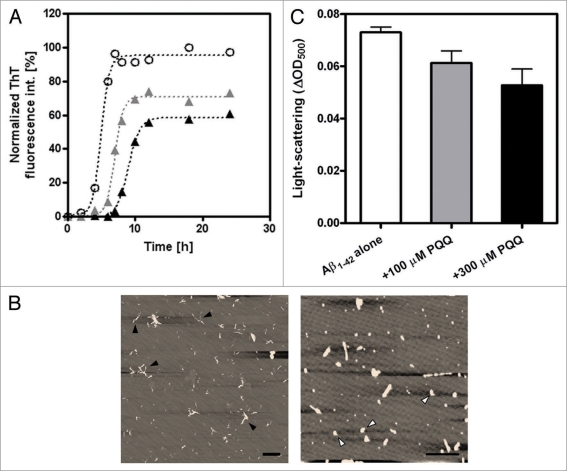
Figure 2.
Inhibitory effect of PQQ on the fibril formation of amyloid β (1–42). (A) The time courses of amyloid fibril formation of Aβ1–42 as determined by ThT fluorescence assay analysis. No additive (50 µM Aβ1–42) (white circles), +100 µM PQQ (gray triangles), +300 µM PQQ (black triangles). The sigmoidal curve analysis was performed by PRISM (GraphPad Software). (B) AFM revealed the formation of amyloid fibrils, with short fibrillar morphology, having a diameter of 6∼8 nm and a length of 0.5∼1 µm (Left; 50 µM Aβ1–42). In the presence of PQQ, there are amorphous aggregates having a diameter of 4∼6 nm and length of 10∼500 nm were detected (Right; 50 µM Aβ1–42 + 300 µM PQQ). Scale bars: 1 µm. All images are a height mode. (C) The effect of PQQ on the aggregation of Aβ1–42 was monitored by light scattering at 500 nm after 20 h incubation, n = 2. 50 µM Aβ1–42 (white bar), 50 µM Aβ1–42 + 100 µM PQQ (gray bar), 50 µM Aβ1–42 + 300 µM PQQ (black bar).

