
Figure 5.
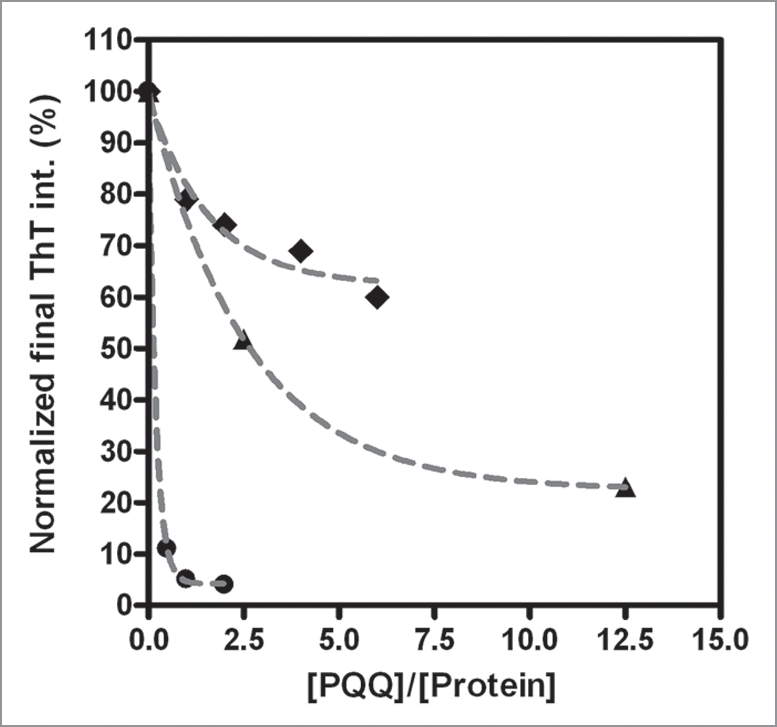
Efficiency of PQQ’s Inhibitory activity depending on amyloid proteins. The final fluorescence intensity of ThT was normalized as a percentage of the value of control which means amyloid protein only as 100%. [PQQ]/[Protein] was the molar ratio of PQQ to each amyloid proteins; α-Syn WT (black circles), Aβ1–42 (black diamonds) and PrP (black triangles). The data of α-Syn used here was from ref. 11.