
Figure 2.
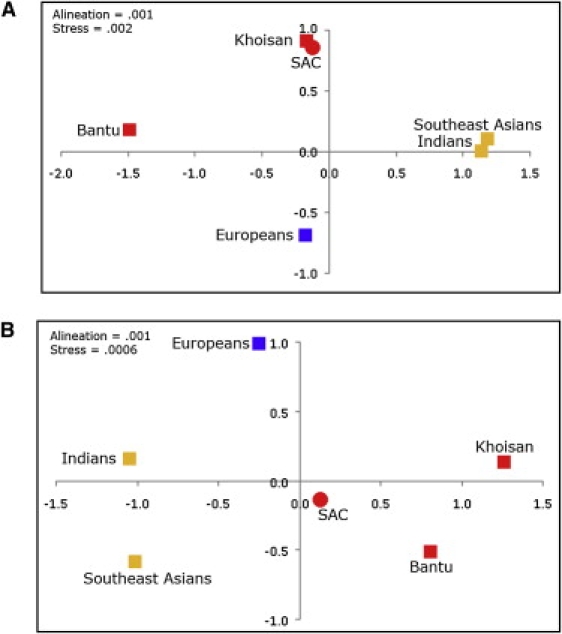
MDS Plots Illustrating the Relationships between the South African Coloured Population and the Five Putative Parental Populations
(A) MDS plot based on mtDNA Hg frequencies.
(B) MDS plot based on NRY Hg frequencies.
The five metapopulations used as putative parental populations include Europeans, Indians, Khoisan, Bantu speakers, and southeast Asians. The European dataset included British, French, Dutch, German, and Austrian populations; the Indian dataset included populations from the Bengal Bay coast (Sri Lanka, Bangladesh, and eastern states of India); the Khoisan dataset included all available Khoisan data; the Bantu dataset included Bantu-speaking populations from South Africa and central Africa; and the southeast Asian dataset included populations from the Malay Peninsula, Sumatra, Java, and neighboring smaller isles. Because different individuals and populations have been analyzed for mtDNA and NRY, sample sizes from these metapopulations differ between the two analyses. Sample sizes of European, Indian, Khoisan, Bantu, and southeast Asian populations were, respectively: n = 6092, n = 1246, n = 298, n = 459, and n = 616 for mtDNA and n = 353, n = 766, n = 122, n = 499, and n = 66 for NRY. The lower population sample sizes for the NRY data result from the nonoverlapping nature of the markers used in the different studies. These comparative data were obtained from the MURKA database, compiled from published sources by O. Balanovsky, V. Zaporozhchenko, R. Sychev, A. Pshenichnov, and E. Balanovska.