
Figure 1.
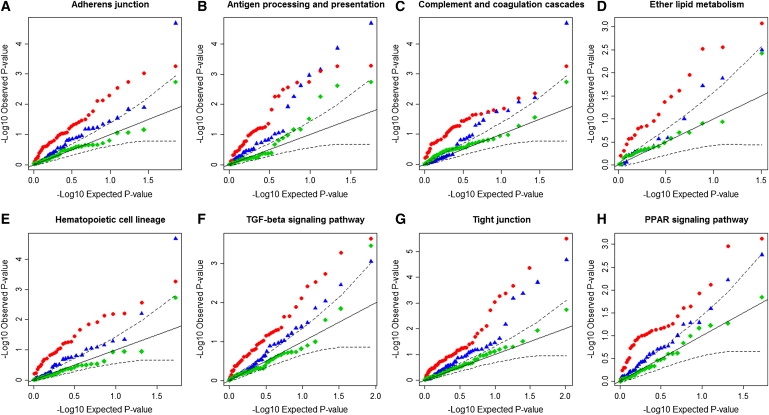
Quantile Quantile Plots of the Representative eSNP p values for the Eight Pathways
The eight pathways are: (A) adherens junction, (B) antigen processing and presentation, (C) complement and coagulation cascades, (D) ether lipid metabolilsm, (E) hematopoietic cell lineage, (F) TGF-β signaling pathway, (G) tight junction, and (H) PPAR signaling pathway.
On each plot, the x axis is −log10 of the expected p values of an equally sized set of SNPs under a uniform distribution. The y axis is −log10 of the observed p values. The SNPs presented in each plot are the representative eSNPs for genes in the corresponding pathway. The representative eSNPs are identified on the basis of WTCCC PT2D. Red dots represent their p values (PT2D) based on WTCCC. Blue triangles represent their p values (PT2D) based on DIAGRAM meta-analysis. Green diamonds represent their p values (PT2D) based on DIAGRAM samples excluding the WTCCC detection samples. Black solid lines denote the uniform null distribution. Dashed lines denote 95% confidence intervals of deviation from the null distribution.