
Figure 2.
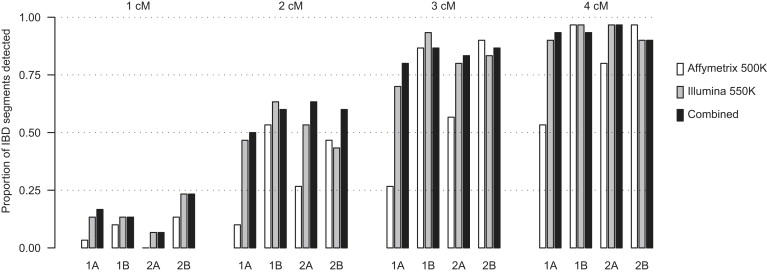
Power to Detect IBD with BEAGLE
Four sizes of IBD segments are considered, and these are labeled at the top of the plot. Four different regions of the genome are interrogated, and these are labeled at the bottom of the plot. Two SNP arrays plus their union (“Combined”) are considered for each segment size and region. Each bar is the proportion detected out of 30 artificial IBD segments.