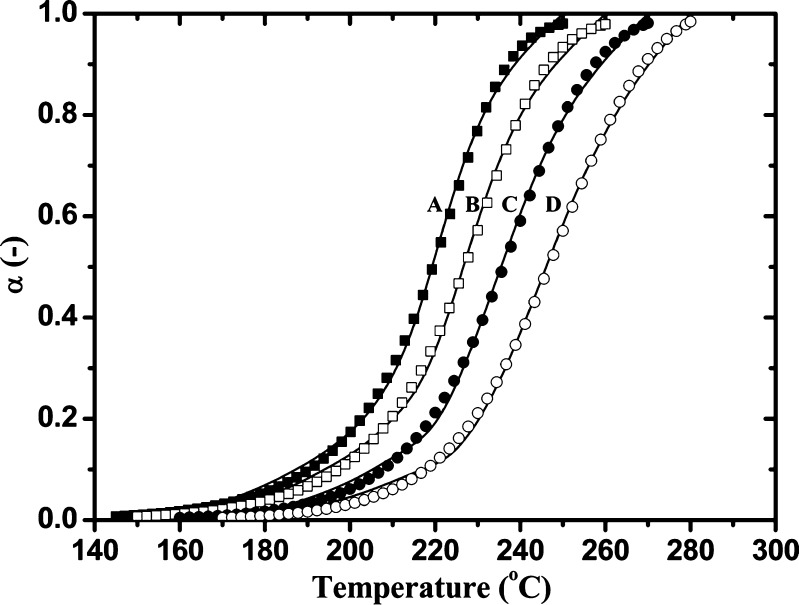
Fig. 8.
Nonisothermal conversion curves for the decomposition process of the folic acid under the Folnak® degradation measured at the different heating rates: a—calculated α(T) curve at 2.5°C min−1 (black-filled square); b—calculated α(T) curve at 5°C min−1 (open square); c—calculated α(T) curve at 10°C min−1 (black-filled circle); d—calculated α(T) curve at 20°C min−1 (open circle); Full lines are the experimental conversion curves at the different heating rates. All symbol curves were calculated using Eq. 12 for the kinetic parameters shown in Table III

