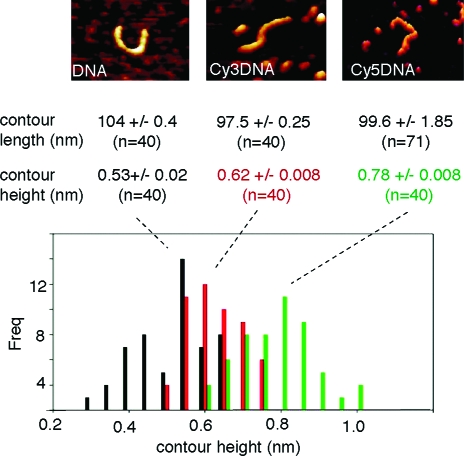
Figure 5.
Atomic force microscopy (AFM) imaging of mica-adsorbed identical DNA (left), Cy3-DNA (middle), and Cy5-DNA (right) fragments. A putative DNA or CyDNA molecule can be seen at the center of each image. Histogram of AFM contour heights for n = 40 molecules for DNA (black), Cy3-DNA (red), and Cy5-DNA (green). Contour heights (width) of Cy3-DNAs or Cy5-DNAs were 20% or 40% respectively larger than DNA, while contour lengths were unchanged. Average contour lengths and heights were obtained by fitting a Gaussian to the histogram.

