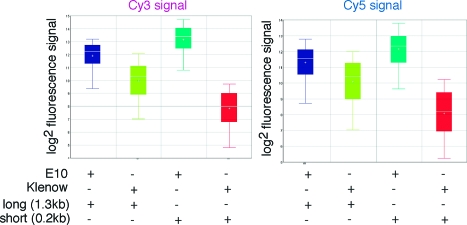
Figure 8.
Box plot showing the influence of fragment length on fluorescence signal. The fluorescence signal of E10 labeled CyDNA (blue/teal) was measured relative to Klenow labeled DNA (lime/red) prepared from templates of the same length (270bp/1.3kb) for Cy3 (left panel) and Cy5 (right panel). E10270 (teal) yielded a 34-fold higher Cy3 signal (or 20-fold higher Cy5 signal than Klenow270 (red)) whereas the longer E101300 fragment (blue) resulted in only a 3.6-fold higher Cy3 signal (2.5-fold higher Cy5 signal) than Klenow1300 (lime). Boxes describe the interquartile range, lines across the box the median and central cross the average. Error bars define the signal spread. While E10 labeled probes can provide enormous signal gains, fragment length is a crucial parameter.

