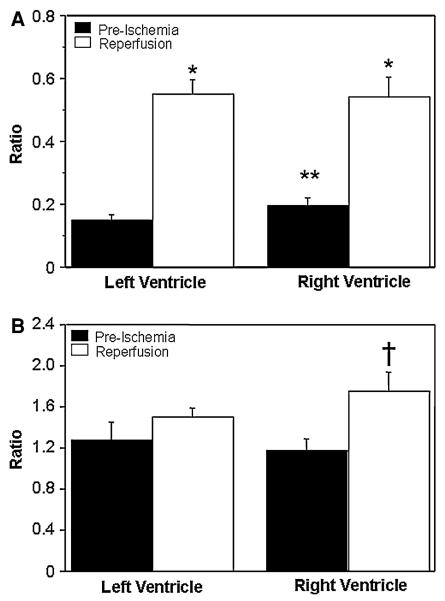
Fig. 4.
Markers of myocardial metabolic stress. The alanine/glutamate (a) and glutamine/glutamate (b) ratios in left and right ventricles calculated before cross-clamping the aorta (pre-ischemia) and after 10 min reperfusion. Data are shown as mean ± SEM (n = 12). *P versus pre-ischemia in the corresponding ventricle. **P versus pre-ischemia in the left ventricle. †P versus all other values

