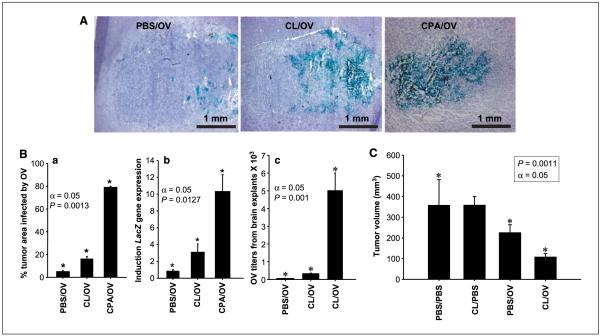
Figure 3.
Effects of macrophage depletion on intratumoral spread of OV and tumor size. A, intratumoral OV-mediated LacZ transgene expression in animals treated with PBS (controls; PBS/OV), CL (CL/OV), and CPA (CPA/OV ) before OV delivery. The microphotographs represent the tumor area within the brain hemisphere (purple hematoxylin counterstaining) and LacZ transgene expression within the tumor (blue staining for β-galactosidase activity). B, a, columns, mean percentage of tumor area infected by OV from the treatment groups described in (A); bars, SD. This experiment was repeated thrice, and one representative result is shown. Significance of pair means comparison was determined by ANOVA followed by post hoc Tukey’s test (n = 4). Asterisks, significant differences. b, quantitative RT-PCR for the transcript encoding LacZ gene. Columns, mean fold induction (n = 4) for the transcript encoding LacZ in tumors of rats treated with OV alone (controls; PBS/OV), both CL and OV (CL/OV), and CPA and OV (CPA/OV); bars, SD. The baseline value of one was attributed to the expression of each gene in control gliomas, and the increase in LacZ expression was evaluated (Materials and Methods). The experiment was repeated thrice; one representative experiment is shown. Asterisks, means comparisons done with Tukey’s test showed significant difference among the three treatment groups. c, viral titers from tumors treated with PBS and OV (controls; PBS/OV), CL and OV (CL/OV), and CPA and OV (CPA/OV) were quantified on VERO cells (n =8). Columns, average of OV titers obtained; bars, SD. Viral titers of animals pretreated with CL increased 5-fold compared with those of animals treated with OV alone, whereas those treated with CPA increased 100-fold compared with control tumors. Asterisks, means comparisons done with ANOVA followed by a post hoc Tukey’s test showed significant difference between the three treatment groups. C, brain tumor volume (mm3) was measured by MR imaging in animals treated with mock solution (PBS/PBS ), CL alone (CL/PBS), OV alone (PBS/OV), and CL and OV (CL/OV); n = 3. Asterisks, comparisons of the means with Tukey’s test showed significant changes, with α = 0.05 among the three pair comparisons. No significant difference was present between PBS/PBS and CL/PBS treatment groups.

